
Buying and vehicle history
UK used car market ranked most transparent, according to carVertical
According to carVertical’s Market Transparency Index, the United Kingdom ranks first among the 30 countries in the study. Here is what that score measures, how Great Britain compares on key risks, and why a plate check still matters before you buy.
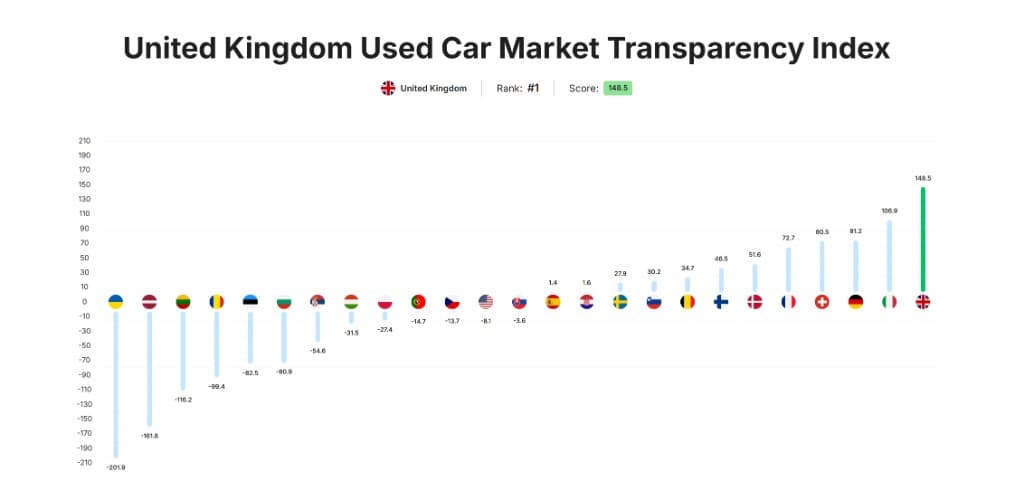
UK ranked first, according to carVertical
carVertical’s Market Transparency Index chart for this research cycle puts the United Kingdom at rank #1 with a score of 148.5. On that same chart, Italy, Germany, Switzerland and France follow, while several Eastern European markets sit deep in negative territory.
That does not mean UK used cars are risk-free. It means that, on carVertical’s own measures of hidden or false information, Britain scored better than the other countries in the set.
What the index measures
According to carVertical, the index measures the level of potentially hidden or false information a customer may face when buying a used car. The research covers the 30 countries where carVertical has offered car history reports for at least one year.
carVertical says the work uses data from reports customers actually bought over 12 months (October to September each year), and only from reports that meet its internal quality bar. One example it gives: a quality report must have at least three odometer readings.
How the six factors are weighted
According to carVertical, the index is built from six factors with a maximum score of 1.2. Its data experts weighted each factor differently because they believe each risk affects transparency differently:
carVertical Market Transparency Index scoring weight per factor (maximum total 1.20)
| Factor | Weight |
|---|---|
| Percentage of odometers clocked | 0.30 |
| Average odometer rollback value | 0.15 |
| Percentage of damaged cars | 0.20 |
| Relative damage value (damage ÷ GDP per capita) | 0.20 |
| Percentage of imported used cars | 0.30 |
| Average age of checked cars | 0.05 |
| Total | 1.20 |
Great Britain vs Ukraine and Czechia
carVertical’s country comparison view for Great Britain, Ukraine and the Czech Republic shows why the UK’s headline rank can look strong even when some individual metrics are mid-table.
carVertical comparison metrics across Great Britain, Ukraine and Czech Republic
| Topic | Great Britain | Ukraine | Czech Republic |
|---|---|---|---|
| Odometers clocked | #5 · 2.27% | #24 · 9.46% | #16 · 3.91% |
| Average odometer rollback | #2 · 34,896 mi | #19 · 57,410 mi | #16 · 55,326 mi |
| Damaged cars | #2 · 17% | #18 · 54.72% | #15 · 54.04% |
| Average damage value | #17 · €4,357 | #10 · €3,550 | #6 · €3,239 |
| Imported used cars | #1 · 2.34% | #24 · 78.38% | #9 · 49.56% |
| Average age of checked cars | #23 · 11.24 yrs | #18 · 10.58 yrs | #15 · 10.48 yrs |
Source screenshot from carVertical’s country comparison for Great Britain, Ukraine and the Czech Republic:
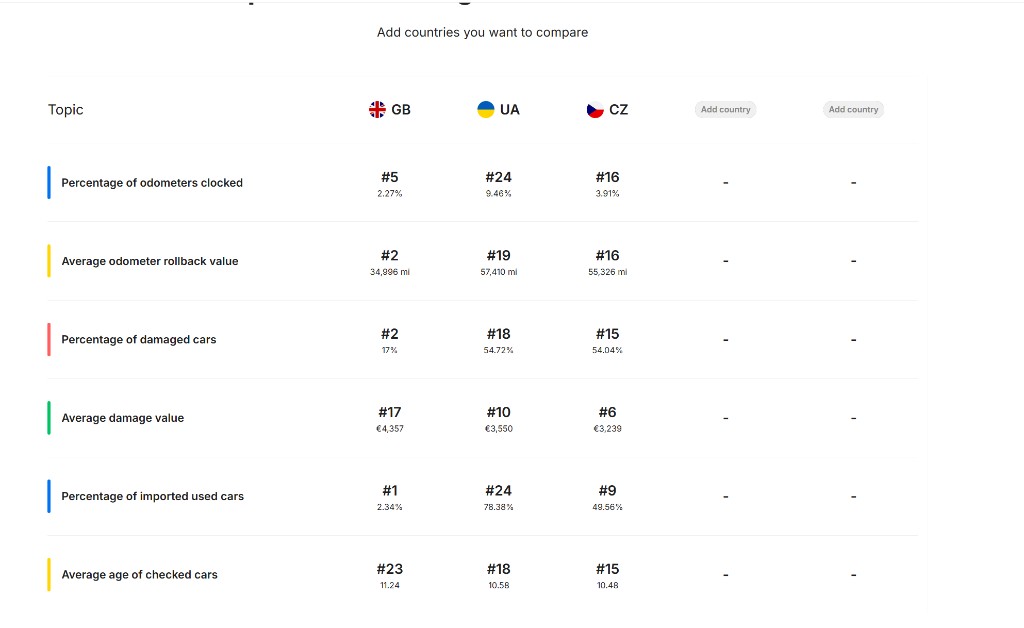
On this snapshot, Great Britain ranks especially well on import share and damaged-car share, and near the top on average rollback size, while average damage value and average age sit further back. Ukraine and Czechia show much higher shares of damaged and imported used cars in the same table.
What this means for UK buyers
A first-place country score is useful context. It is not a green light for any one car. Mileage still gets clocked. Write-offs still get repaired and sold. Finance and stolen markers still need a proper check.
If you are buying in the UK, treat carVertical’s index as background, then verify the registration in front of you: MOT and mileage pattern, tax status, and a full history check for finance, write-off and stolen records before you pay a deposit.
For how Caroat’s own checks compare with carVertical’s product, see Caroat vs carVertical.
Check a UK registration
Sources
- Used car market transparency indexcarVertical
FAQ
What is carVertical’s Market Transparency Index?
According to carVertical, it measures how much potentially hidden or false information a used-car buyer may face. The index uses six weighted factors from quality car history reports bought over 12 months across countries where carVertical has offered reports for at least one year.
Where does the UK sit in the ranking?
According to the chart carVertical published for this research cycle, the United Kingdom ranks first with a score of 148.5, ahead of Italy, Germany, Switzerland and France.
Does a high transparency score mean every UK used car is safe to buy?
No. A higher country score means, on carVertical’s measures, less hidden risk on average. Individual cars can still have mileage issues, write-offs, finance or stolen markers. Always check the registration in front of you.